Thread 2, Day 5 - Wednesday, January 17, 2024
Agenda
- Activity: College Board Digital Portfolio
- If you have not already, submit your AP Create Task.
Important
A link to a draft of your written responses for the AP Create Task must be posted on Notion.
- If you have not already, submit your AP Create Task.
- Tutorial: Creating Pie Charts and Donut Charts
- Learn how to create bar charts and line charts using the
Chartsframework andSwiftUI.TipYou can follow this tutorial by creating either an iOS or macOS application in Xcode – both work equally well – however, on some computers, macOS projects will compile and run faster.
- Learn how to create bar charts and line charts using the
- Exercise: Create a Pie or Donut Chart
- Using what you learned in the tutorial above, select either a pie chart or a donut chart.
- Create data structures that you can model using the chart type you selected.
- Then make a chart to visualize the data.
- For deeper learning, if you have time, make both types of charts using your own data.
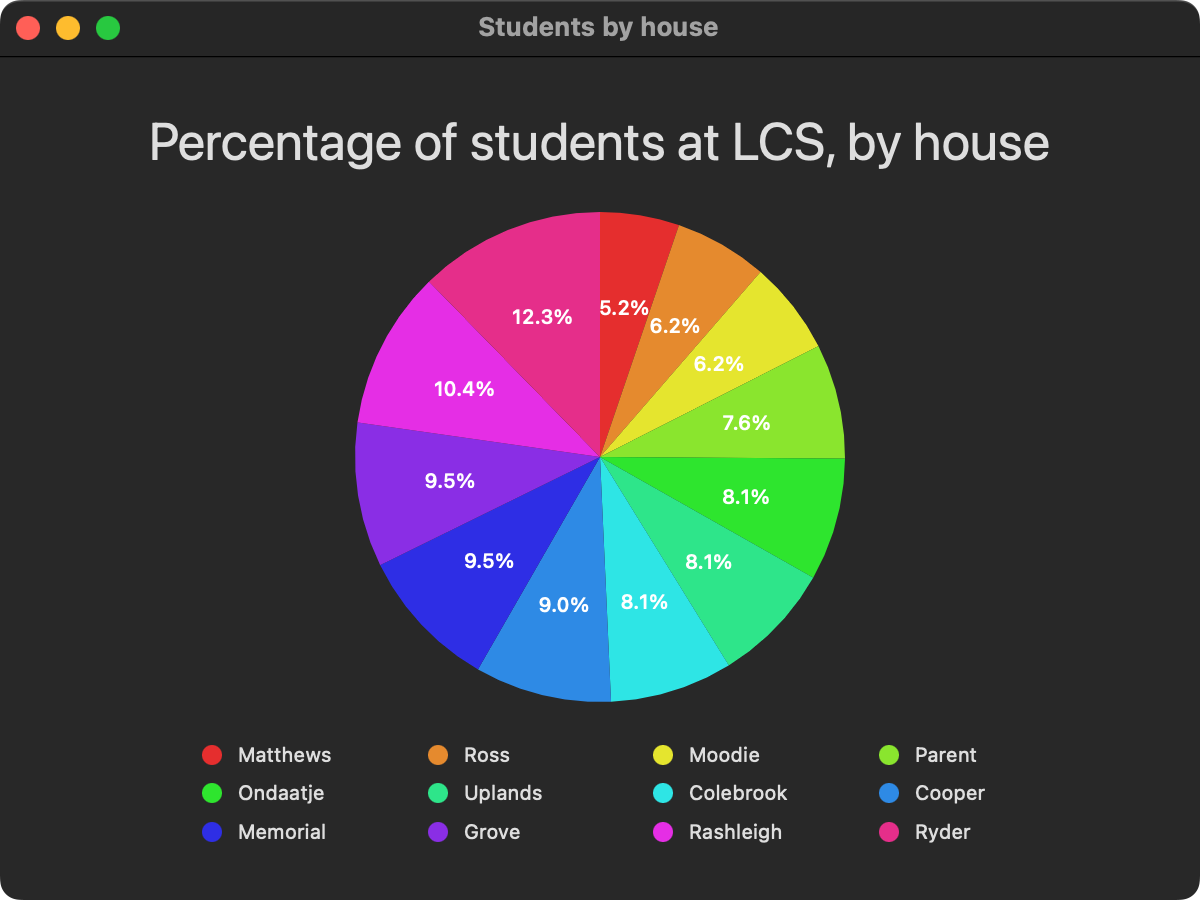
Example
Here is an example using made-up data regarding the proportion of students in each house at Lakefield College School:
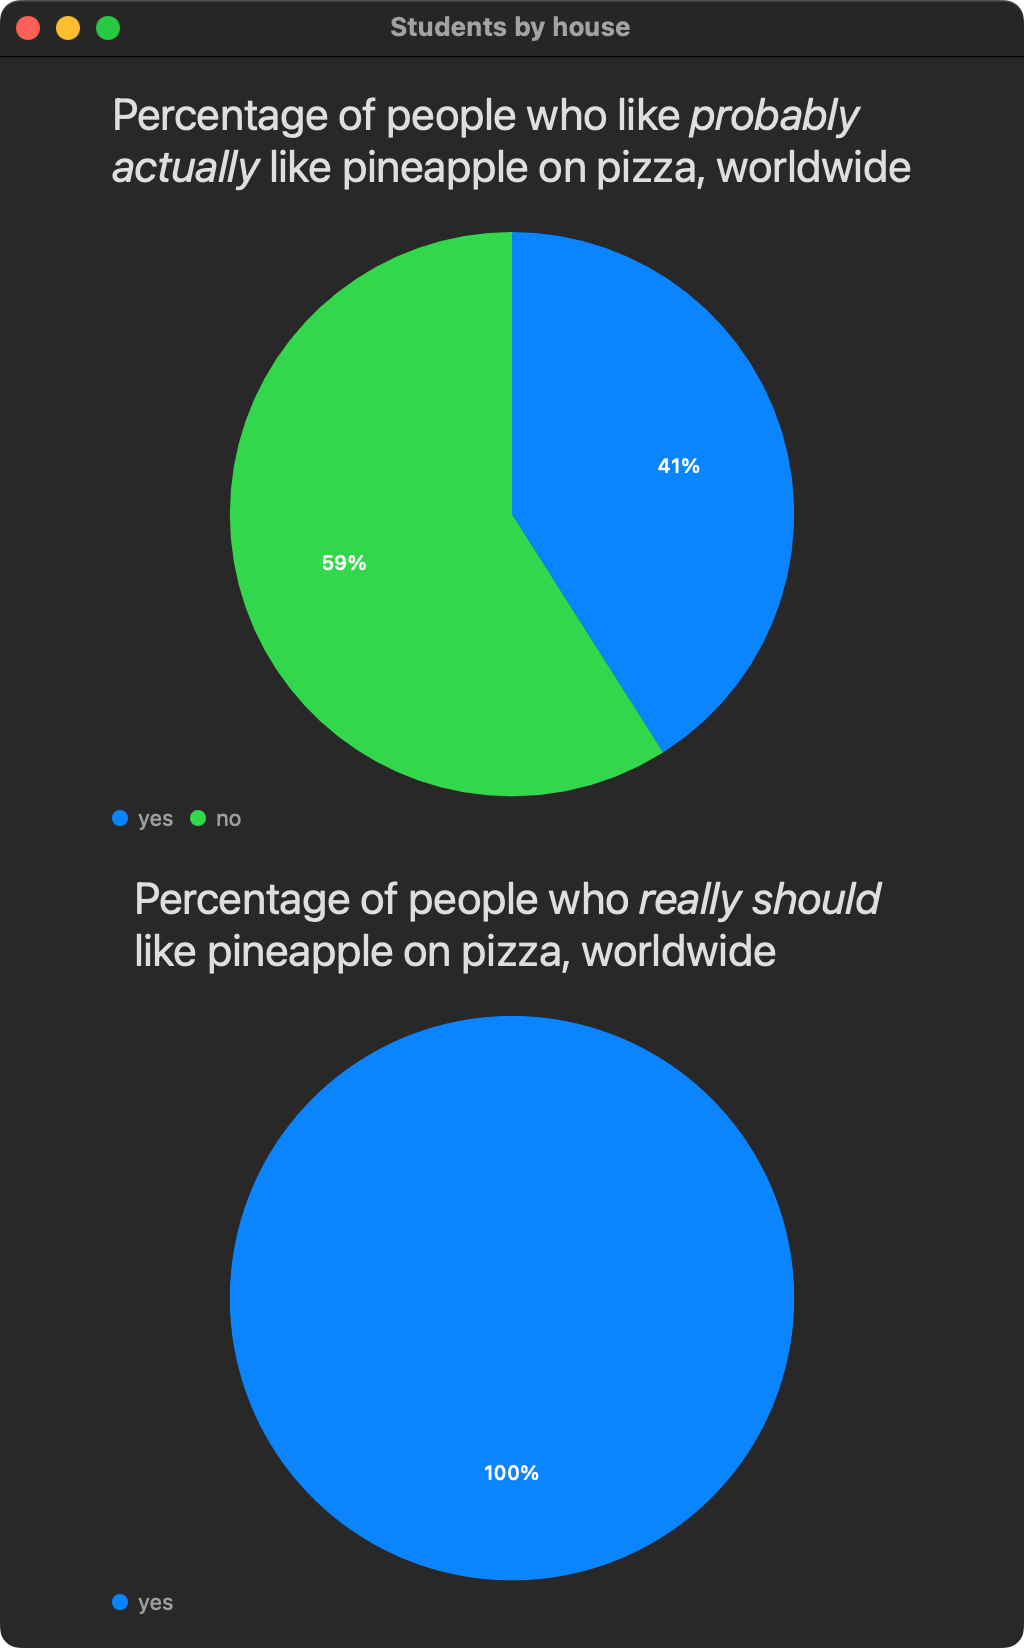
Here is a silly example, but it is good practice with making charts: